Stratum disturbance induced by shield tunnels based on random field theory
-
摘要: 盾构开挖不可避免会造成周围地层扰动,引起地表及深部地层发生变形,变形过大时会威胁到周围建构(筑)物的安全,因而有必要开展隧道施工地表及地层变形扰动方面的研究。首先在土体均质条件下,开展二维数值计算,并分别利用Peck公式拟合优度和多项式拟合优度来评价水平向地层和竖向地层的变形扰动程度;继而考虑土体参数空间变异性,借助Monte Carlo策略,开展盾构施工对地层扰动规律影响研究的随机性分析。研究结果表明:Peck公式拟合优度可以较好地反映施工引起水平地层沉降变形程度;多项式拟合优度可以较好地反映竖向地层水平变形受到施工的影响程度;土体模量空间变异性会对盾构隧道施工地层扰动产生较大的影响,模量较大时会对盾构施工地层扰动有一定的“抑制”作用,但总体上越靠近盾构隧道,地层受到扰动越大。研究可以为类似工程的设计和施工提供有益的参考。Abstract: The shield tunnel will inevitably cause the disturbance of the surrounding stratum and lead to the deformation of the surface and deep strata. Too large deformation of the surface and strata will threaten the safety of the surrounding construction. Therefore, it is necessary to carry out the studies on the disturbance of the surface and strata in tunnel construction. Firstly, under homogeneous soil conditions, two-dimensional numerical calculation is conducted, and the goodnesses of fit of the Peck's formula and polynomials are used to evaluate the degree of deformation disturbance of the horizontal and vertical strata, respectively. Then, considering the spatial variability of soil parameters, within the Monte Carlo framework, the random analysis is performed for the influences of shield construction on stratum disturbance. The results show that the goodness of fit of the Peck's formula can well reflect the degree of settlement of the horizontal strata induced by tunnels. The goodness of fit of the polynomials can well reflect the degree of horizontal deformation of the vertical strata affected by the construction. The spatial variability of soil modulus has a great impact on the stratum disturbance induced by the shield tunnel, and the larger modulus will restrain the disturbance induced by the shield tunnel, but on the whole, the greater stratum disturbance will occur when it is closer to the shield tunnel. The results can provide a useful reference for the design and construction of similar projects.
-
Keywords:
- shield tunnel /
- deep stratum /
- deformation and disturbance /
- goodness of fit /
- spatial variability /
- random field
-
0. 引言
沿海地区的水下地下工程建设不可避免地会受到的地下水渗流影响[1],将导致施工区域软土地基沉降,造成周围建筑物和地面的不均匀沉降。为保持原有地层稳定,人工冻结技术在岩土工程中广泛应用[2],包括海底隧道和城市地铁建设[3]。流速较大条件下易出现冻结壁不闭合的现象[4],不能满足施工设计的要求。
在人工冻结过程中,确定地层的冻结范围是非常重要的。基于热势叠加理论,Hu等[5]和Pimentel等[6]推导了静水和渗流条件下不同冻结形式下的稳态温度场的理论公式,用来预测圆形冻结壁的厚度和平均温度[7]。地下水渗流的存在使等温线向下游移动,下游冻结壁厚度大于上游[8]。但现有的解析解不能揭示多孔介质冻结过程中渗流与各物理场的耦合机制。
当存在地下水渗流时,水流携带的热量导致冻结区的解冻[9],研究渗流条件下冻结过程中的多场耦合机制是必要的。考虑冻结过程中多场耦合变化,建立了渗流条件下人工冻结过程多场耦合数值模型[10]。饱和土的冻结过程涉及多场、多相,针对沿海地区地下水含盐量高的问题[11],在多孔介质理论框架下建立多场宏观模型,模拟地下水渗流条件下的冻结过程。
本文建立了渗流条件下砂地层在人工冻结时的水-盐-热-力耦合模型。充分考虑非对流通量对传热传质的影响,固体颗粒对盐的解吸和吸附作用,以准确模拟人工冻结过程。采用Navier-Stokes方程来考虑渗流过程中流体的动量守恒,研究了单管冻结条件下,不同渗流速度下滨海砂地层中各组分的分布规律。
1. 控制方程
1.1 固体基质质量守恒方程
多孔介质中固体基质的质量守恒方程为[12]:
1(1−n)∂n∂t+1(1−wsp)∂wsp∂t+βsT∂T∂t=βsP∂Pl∂t+∂εv∂t。 (1) 式中:wsp为固体颗粒吸附盐的质量分数;T为温度;Pl为孔隙水力压力。
1.2 水分守恒方程
多孔介质中水分质量守恒方程的展开式为
nSl(1−wlp)βlpρl∂Pl∂t+div(ρlwql)−div(jlp)=−∂mi∂t−∂mlp∂t+nρlw∂Si∂t+nρlwSp∂t−Slρlw∂n∂t+nSlρl[(1−wlp)βlw+1]∂wlp∂t−nSlρlw∂εv∂t+(1−wlp)nSlβlTρl∂T∂t。 (2) 式中:βlp为液相压缩率;βlT为液体热膨胀系数;βlw为浓度依赖系数;∂mi/∂t为冰的结晶速率;∂mlp/∂t为结晶盐水合物的形成速率;jlp为盐在液相中的非对流通量;ρlw为液态的水密度;ρl为液相的密度;wlp溶解盐的质量分数。
冰的质量守恒方程为[13]
1n∂n∂t+1Si∂Si∂t+∂εv∂t=1nSiρi∂mi∂t, (3) 式中,ρi为冰的密度。
1.3 盐分守恒方程
考虑冻结多孔介质液相中盐溶液的非对流通量,溶液的质量守恒为
∂(nSlρlp)∂t+div(nSlρlpvl)+div(jlp)=−∂mp∂t−∂mlp∂t。 (4) 式中:jlp为冻土中盐的非对流通量;∂mp/∂t为结晶盐的相变速率。
可得到展开的溶液质量守恒方程:
1n(1−ρswspρlwlp)∂n∂t−1Sl∂Si∂t−1SlSp∂t+∂εv∂t+[βlp+(1−n)wspρsnSlρlwlpβsP]∂Pl∂t+(1−wlpβlw)wlp∂wlp∂t+1wlp(1−n)ρsnSlρl∂wsp∂t−[(1−n)wspρsnSlρlwlpβsT+βlT]∂T∂t=div(ρlwlpql)+div(jlp)−∂mp∂t−υlMlMp∂mp∂tnSlρlwlp。 (5) 式中:wlp为液相中盐的质量分数;jlp冻为土中盐的非对流通量;ql为液相相对流动体积;Ml为液体的摩尔质量;Mp为结晶盐的摩尔质量。
考虑多孔介质中盐的吸附-解吸效应,冻土中盐分的沉积动力学公式为
(1−n)ρs∂wsp∂t + div[(1−n)ρsvs]=kadnSlρlwlp−kde(1−n)ρswsp, (6) 式中,kad和kde分别为吸附系数和解吸系数。
结晶盐的质量守恒方程为[13]
1n∂n∂t+1Sp∂Sp∂t+∂εv∂t=1nρpSp∂mp∂t, (7) 式中:ρp为结晶盐的密度。
1.4 能量守恒方程
多孔介质冻结过程中的能量守恒与热容和热传导度有关,能量守恒方程表示为
[(1−n)ρscs+nSlρlcl+nSiρicii+nSpρpcpp]∂T∂t+div[(clpjlp−ρlclql)(T−T0)−λeff∇T]=Lwi∂mi∂t+Lsc∂mp∂t+LlpυlMlMp∂mp∂t。 (8) 式中:g为重力加速度矢量;λeff为冻土有效导热系数;cs,cl,cii和cpp分别代表固体颗粒、液相、冰和结晶盐的热容;Lwi,Llp,Lsc分别为水、冰的相变潜热、自由水、结合水相变潜热和溶液-结晶盐的相变潜热。
1.5 动量守恒方程
人工冻结过程中的各向异性和渗流状态影响着砂土地层的冻结状态,在动量守恒中引入Navier-Stokes方程来描述渗流的动量守恒。土体冻结过程中π相的动量守恒方程为
ρπnπdvπdt−div(nπσπ)−ρπnπgπ=˙mπ。 (9) 式中:σπ为π相的应力张量;˙mπ为π相与其他相的动量交换,gπ为π相的体积密度。
可得到土体的动量守恒方程:
nρl(Fg−∇Plρl+μl∇2vl)−div(σ′+SlPl+SiPi+SpPp)−[(1−n)ρs+nSlρl+nSiρi+nSpρp]g=˙mπ。 (10) 式中:Fg为单位质量力;μl为液相的动力黏度;Pi为冰压力;Pp为孔隙中盐结晶压力;σ′为有效应力。
1.6 边界条件
将耦合方程(1)~(3),(5)~(8),(10)代入COMSOL Multiphysics进行求解。边界与外部存在热对流和热交换和水、盐供应。要解耦合方程,必须满足下列边界条件:
(ρlwql−jlp)⋅n=¯Pl , (ρlwlpql+jlp)⋅n=¯wlp , [(ρlwclwql+clpjlp)⋅(T−T0)−λeff∇T]⋅n=¯T , σ⋅n=¯εv 。} (11) 2. 理论验证
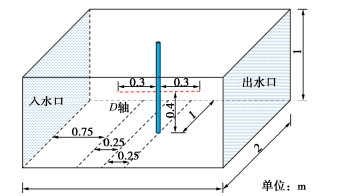
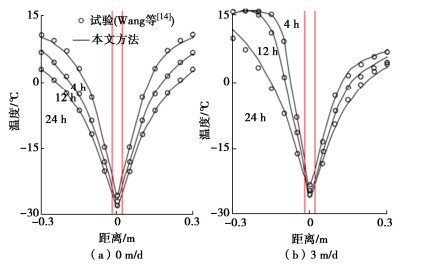
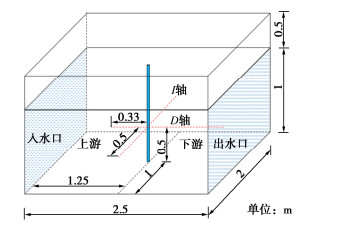
结合Wang等[14]的渗流条件下人工冻结过程温度场验证本文理论模型。模型试验如图 1所示,箱体中间设置一根外径为42 mm的冷冻管。整个模型的初始温度为10℃,冻结管的初始温度为-30℃。在箱体0.4 m处设置D轴。表 1给出了本研究使用的物理参数,模型试验所用砂土的干密度为1612 kg/m3,孔隙率为0.33,渗透系数为2.28×10−4 m/s。理论模型中D轴的温度分布结果与试验结果对比如图 2所示。可以看出理论分析结果与模型试验结果基本一致。
名称 符号 值 单位 名称 符号 值 单位 吸附系数 kad 2.5×10⁻⁴ s-1 水冰相变潜热 Lwi 6.01 kJ·mol-1 解吸系数 kde 1.5×10⁻⁴ s-1 液相压缩率 βlp 1×10⁻⁷ kPa-1 固相热膨胀系数 βsT 7.8×10⁻⁶ K-1 液体热膨胀系数 βlT 2.1×10⁻⁴ K-1 浓度依赖系数 βlw 0.6923 — 液态水密度 ρlw 1000 kg·m-3 冰的密度 ρl 917 kg·m-3 摩尔气体常数 R 8.2 J·mol-1·K-1 结晶盐密度 ρp 1460 kg·m-3 结晶盐的物质的量 Mp 0.142 kg·mol-1 盐的动力学参数 Kp 1.8×10⁻³ s-1 液相的物质的量 Ml 0.018 kg·mol-1 吸湿膨胀系数 βs 1.5×10⁻⁴ — 固体热容 cs 850 J·kg-1·K-1 冰的动力学参数 Ki 5.82×10⁻³ s-1 冰的热容 cii 2090 J·kg-1·K-1 自由水结合水相变潜热 Llp 73.04 kJ·mol-1 结晶盐的热容 cpp 1743 J·kg-1·K-1 盐、结晶盐相变潜热 Lsc 2.34 kJ·mol-1 固相压缩率 βsp 2×10⁻⁴ kPa-1 ![]()
3. 参数研究
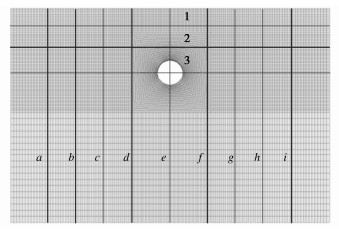
通过参数化研究,分析了不同渗流速度和温度梯度下各组分在砂层中的空间分布。砂土层模型试验渗流如图 3所示。模型边界目标参数如表 2所示,砂层中wlp0和T0的初始值分别为0.005和10℃。冻结管壁温度设为-27℃,渗流只存在于砂层底部。冰饱和度Si、结晶盐饱和度Sp、吸收盐含量wsp0的初始条件和边界条件均为0。选取图 2中位于砂层中4条轴线Dc,Ds,Ic,Is,绘制温度、冰、盐、位移分布图。
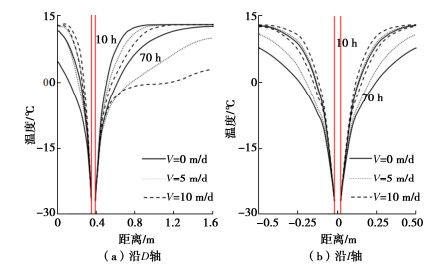
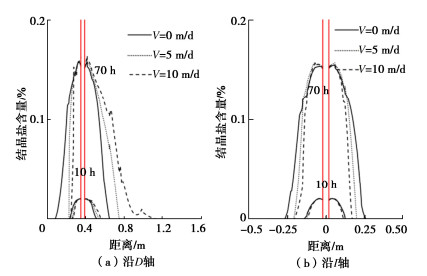
表 2 参数分析中使用的目标参数Table 2. Target parameters used in parametric studies项目 Pl0/kPa Tp/℃ T0/℃ wlp0 wlp 渗流/(m·d-1) 试验 γwΔH -30 10 — — 0, 3 渗流 γwΔH -27 13 0.005 0.005 0, 5, 10 不同渗流速度的下部砂层中温度沿D轴和I轴分布情况如图 4所示。随着渗流速度从0 m/d增加到10 m/d,在人工冻结70 h后,在沿着D轴方向上的砂层上游的温度增加8.8℃,下游最高降低了13.2℃,如图 4(a)所示。当渗流速度从0 m/d增加到10 m/d,人工冻结70 h后,冻结管左右两侧的沿着I轴的温度升高了6.2℃,如图 4(b)所示。
![]() 图 4 在不同渗流速度下,冻结10,75 h后,砂层中温度分布Figure 4. Distribution of temperature along (a) D axis and (b) I axis in sand stratum after 10 and 75 hours of freezing under different seepage velocities
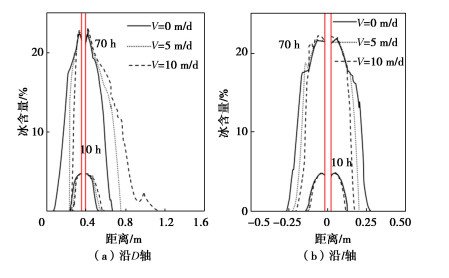
图 4 在不同渗流速度下,冻结10,75 h后,砂层中温度分布Figure 4. Distribution of temperature along (a) D axis and (b) I axis in sand stratum after 10 and 75 hours of freezing under different seepage velocities不同渗流速度对下部砂层中含冰量沿D轴和I轴分布情况如图 5所示。渗流导致水分开始冻结的位置沿着D轴向下游移动。随着渗流速度从0 m/d增加到10 m/d,在人工冻结70 h后,在沿着D轴方向上的砂层上游水分冻结的位置向下游移动了63.5%,下游中水分冻结的位置向下游移动了173.2%,如图 5(a)所示。当渗流速度从0 m/d增加到10 m/d,即人工冻结70 h后,冻结管左右两侧的沿着I轴的水分冻结范围缩减了37.8%,如图 5(b)所示。
![]() 图 5 在不同渗流速度下,冻结10,75 h后,砂层中冰含量分布Figure 5. Distribution of ice content along (a) D axis and (b) I axis in sand stratum after 10 and 75 hours of freezing under different seepage velocities
图 5 在不同渗流速度下,冻结10,75 h后,砂层中冰含量分布Figure 5. Distribution of ice content along (a) D axis and (b) I axis in sand stratum after 10 and 75 hours of freezing under different seepage velocities不同渗流速度对下部砂层中结晶盐量沿D轴和I轴分布情况如图 6所示。图 6(a)给出了沿着渗流方向上结晶盐含量随着渗流和冻结时间变化的分布情况,盐分析出的位置沿着D轴向下游移动。随着渗流速度从0 m/d增加到10 m/d,在人工冻结70 h后,在沿着D轴方向上的砂层上游盐分开始析出的位置向下游移动了65.1%,下游中盐分开始析出的位置向下游移动了182.7%。当渗流速度从0 m/d增加到10 m/d,即人工冻结70 h后,冻结管左右两侧的沿着Ⅰ轴的盐分的析出范围缩减了42.7%,如图 6(b)所示。
![]() 图 6 在不同渗流速度下,冻结10,75 h后,砂层中结晶盐含量分布Figure 6. Distribution of crystalline salt content along (a) D axis and (b) I axis in sand stratum after 10 and 75 hours of freezing under different seepage velocities
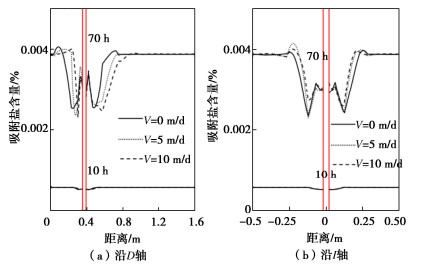
图 6 在不同渗流速度下,冻结10,75 h后,砂层中结晶盐含量分布Figure 6. Distribution of crystalline salt content along (a) D axis and (b) I axis in sand stratum after 10 and 75 hours of freezing under different seepage velocities不同渗流速度对下部砂层吸附盐含量沿D轴和I轴分布的影响如图 7所示。渗流削弱了下游的盐分吸附能力。随着渗流速度从0 m/d增加到10 m/d,在人工冻结70 h后,在沿着渗流的D轴方向上,砂层上游的吸附盐突变位置向下游移动了52%,下游的吸附盐突变位置向下游移动了32%,如图 7(a)所示。当渗流速度从0 m/d增加到10 m/d,即人工冻结70 h后,冻结管左右两侧的沿着I轴的吸附盐突变范围向冻结管方向缩小了16.2%,如图 7(b)所示。
![]() 图 7 在不同渗流速度下,冻结10,75 h后,砂层中吸附盐含量分布Figure 7. Distribution of adsorbed salt content along (a) D axis and (b) Ⅰ axis in sand stratum after 10 and 75 hours of freezing under different seepage velocities
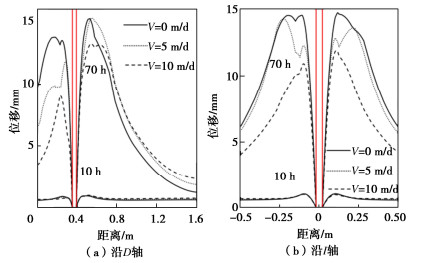
图 7 在不同渗流速度下,冻结10,75 h后,砂层中吸附盐含量分布Figure 7. Distribution of adsorbed salt content along (a) D axis and (b) Ⅰ axis in sand stratum after 10 and 75 hours of freezing under different seepage velocities不同渗流速度对下部砂层中土体位移沿D轴和I轴分布情况如图 8所示。随着冻结时间的增加,砂地层在冻胀和盐胀的作用下土体位移逐渐增加。随着渗流速度从0 m/d增加到10 m/d,在人工冻结70 h后,在沿着D轴方向上的砂层上游的土体位移降低了33.4%,下游的土体位移降低了14.3%,如图 8(a)所示。当渗流速度从0 m/d增加到10 m/d,即人工冻结70 h后,冻结管左右两侧的沿着I轴的土体位移降低了23.1%,如图 8(b)所示。
![]() 图 8 在不同渗流速度下,冻结10,75 h后,砂层中位移分布Figure 8. Distribution of soil displacement along (a) D axis and (b) I axis in sand stratum after 10 and 75 hours of freezing under different seepage velocities
图 8 在不同渗流速度下,冻结10,75 h后,砂层中位移分布Figure 8. Distribution of soil displacement along (a) D axis and (b) I axis in sand stratum after 10 and 75 hours of freezing under different seepage velocities4. 结论
本文推导了渗流条件滨海砂土层人工冻结的水-盐-热-力学耦合模型。利用COMSOL Multiphysics软件对导出的微分方程进行求解。理论计算结果与文献中实验室模型试验结果吻合较好,验证了模型的准确性。通过参数分析,研究了不同渗流速度下的砂地层中各组分的空间分布情况。得出以下3点结论。
(1)在砂层冻结后,地层中的孔隙被堵塞,砂层底部上游的高温流体穿过地层的左右两侧下游流动。随着渗流速度从0 m/d增加到10 m/d,在人工冻结70 h后,砂层上游的最高温度增加8.8℃。冻结管左右两侧的土体位移降低了23.1%,渗流削弱了冻结效果,减小了冻结导致的土体位移。
(2)在垂直于渗流方向上,冻结管左右两侧的冰、结晶盐对称分布。在人工冻结70 h后,随着渗流速度从0 m/d增加到10 m/d,砂层上游水分冻结位置向下游移动63.5%,下游中水分冻结位置向下游移动173.2%,冻结管左右两侧的水分冻结范围缩减37.8%。
(3)冻结区域中盐分的吸附能力是被抑制的。随着渗流速度从0 m/d增加到10 m/d,在人工冻结70h后,砂层上游的吸附盐突变位置向下游移动52%,下游的吸附盐突变位置向下游移动32%,冻结管左右两侧的吸附盐突变范围向冻结管方向缩小16.2%。
-
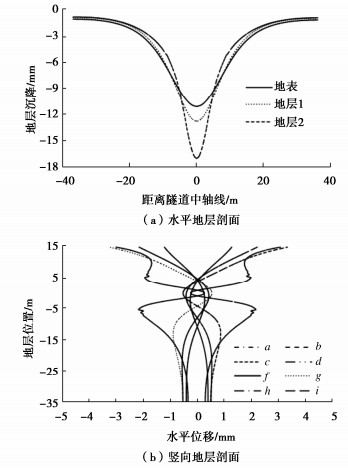
![]()
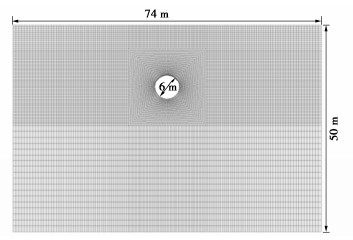
图 2 地层位移分析剖面示意图
Figure 2. Schematic diagram of analysis section for stratum displacement
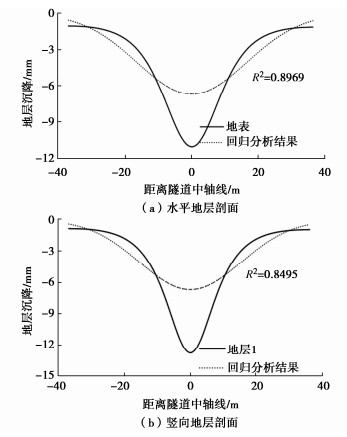
![]()
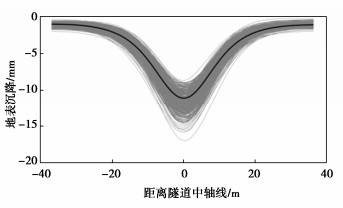
图 4 水平地层沉降曲线及其回归结果对比
Figure 4. Comparison of settlement curves and regression results of horizontal strata
![]()
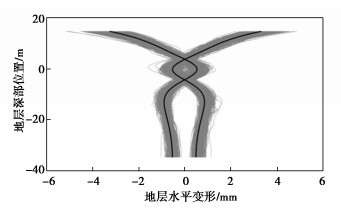
图 5 竖向地层水平变形曲线及其回归结果对比
Figure 5. Comparison of horizontal deformation curves and regression results of vertical strata
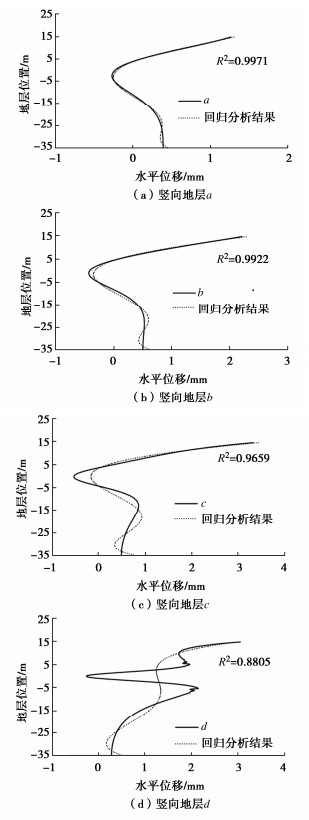
![]()
图 6 竖向地层变形曲线多项式拟合优度对比
Figure 6. Comparison of goodnesses of fit polynomials of deformation curves of vertical strata
![]()
图 7 随机计算结果与确定性计算结果对比(地表沉降)
Figure 7. Comparison between random and deterministic results (surface settlement)
![]()
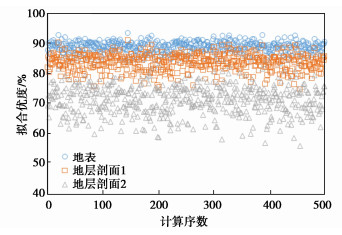
图 8 水平地层沉降Peck公式拟合优度对比结果
Figure 8. Comparison of goodnesses of fit of Peck formula for settlement of horizontal stratum
![]()
图 9 竖向地层的水平变形随机计算结果(地层c和g)
Figure 9. Random results of horizontal deformation (stratum c and g)
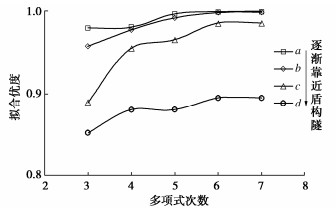
![]()
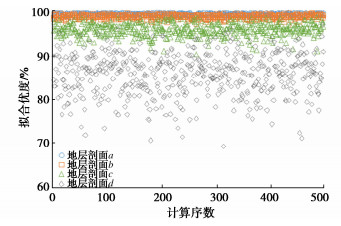
图 10 竖向地层剖面的水平变形拟合优度对比结果
Figure 10. Comparison results for goodness of fit of horizontal deformation of vertical stratum profile
![]()
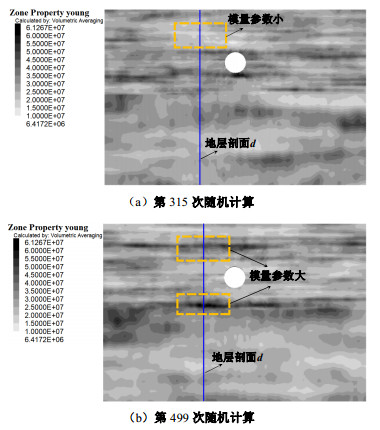
图 11 不同模拟时的模量参数分布情况
Figure 11. Distribution of modulus parameters in different simulations
表 1 土体及管片物理力学参数
Table 1 Parameters of soils and segments
材料 密度/(kg·m-3) 弹性模量/MPa 内摩擦角/(°) 黏聚力/kPa 泊松比 土体 1800 24.0 20 13.0 0.35 管片 2450 24.44×10³ — — 0.20  下载: 导出CSV
表 2 地层竖向变形曲线回归分析
Table 2 Regression analysis of vertical deformation curves
多项式回归分析 竖向地层a 竖向地层b 竖向地层c 竖向地层d 三次多项式 0.9801 0.9577 0.8904 0.8520 四次多项式 0.9812 0.9778 0.9556 0.8805 五次多项式 0.9971 0.9922 0.9659 0.8805 六次多项式 0.9998 0.9989 0.9860 0.8951 七次多项式 0.9999 0.9990 0.9862 0.8951
下载: 导出CSV
-
[1] 彭沉彬, 郭郅威, 姜瑜, 等. 高压富水砂层超大直径盾构隧道下穿既有地铁影响分析和控制措施[J]. 铁道建筑, 2022, 62(2): 127-130. PENG Chenbin, GUO Zhiwei, JIANG Yu, et al. Influence analysis and control measures of super-large diameter shield tunnel under high pressure and water-rich sand stratum underpass existing subway[J]. Railway Engineering, 2022, 62(2): 127-130. (in Chinese)
[2] 赵宗智, 孙建平, 崔明, 等. 考虑盾构隧道轴线倾角的施工地表变形评价[J]. 隧道建设(中英文), 2021, 41(增刊1): 46-53. ZHAO Zongzhi, SUN Jianping, CUI Ming, et al. Evaluation of construction surface deformation considering axis inclination angle of shield tunnel[J]. Tunnel Construction, 2021, 41(S1): 46-53. (in Chinese)
[3] PECK R B. Deep excavation and tunneling in soft ground[C]// Proceeding of the 7th International Conference on Soil Mechanics and Foundation Engineering. Mexico City, 1969: 255-290.
[4] VANMARCKE E H. Probabilistic modeling of soil profiles[J]. Journal of the Geotechnical Engineering Division, 1977, 103(11): 1227-1246. doi: 10.1061/AJGEB6.0000517
[5] 易顺, 岳克栋, 陈健, 等. 考虑抗剪强度空间变异性的双层黏土边坡风险分析[J]. 岩土工程学报, 2021, 43(增刊2): 112-116. doi: 10.11779/CJGE2021S2027 YI Shun, YUE Kedong, CHEN Jian, et al. Risk analysis of double-layer clay slope considering spatial variability of shear strength[J]. Chinese Journal of Geotechnical Engineering, 2021, 43(S2): 112-116. (in Chinese) doi: 10.11779/CJGE2021S2027
[6] 程红战, 陈健, 李健斌, 等. 基于随机场理论的盾构隧道地表变形分析[J]. 岩石力学与工程学报, 2016, 35(增刊2): 4256-4264. CHENG Hongzhan, CHEN Jian, LI Jianbin, et al. Surface deformation analysis of shield tunnel based on random field theory[J]. Chinese Journal of Rock Mechanics and Engineering, 2016, 35(S2): 4256-4264. (in Chinese)
[7] DAVIS M W. Production of conditional simulations via the LU triangular decomposition of the covariance matrix[J]. Mathematical Geology, 1987, 19(2): 91-98. doi: 10.1007/BF00898189
[8] 王润钰, 易顺, 黄珏皓. 基于最小二乘法的隧道地表沉降拟合研究[J]. 科技和产业, 2022, 22(4): 389-393. WANG Runyu, YI Shun, HUANG Juehao. Study on surface settlement induced by tunnel based on least square method[J]. Science Technology and Industry, 2022, 22(4): 389-393. (in Chinese)
[9] PHOON K K, KULHAWY F H. Characterization of geotechnical variability[J]. Canadian Geotechnical Journal, 1999, 36(4): 612-624.
[10] EL-RAMLY H, MORGENSTERN N R, CRUDEN D M. Probabilistic stability analysis of a tailings dyke on presheared clay shale[J]. Canadian Geotechnical Journal, 2003, 40(1): 192-208.
计量
- 文章访问数: 89
- HTML全文浏览量: 8
- PDF下载量: 16