Experimental research on two-dimensional deformation monitoring based on distributed optical fiber sensing technology
-
摘要: 科学合理的岩土体变形监测是岩土工程稳定性和安全性评价的重要指标,充分发挥分布式传感光纤测量技术特点,基于特殊设计的光纤变形试验装置,提出了一种基于分布式光纤传感技术的二维变形监测方法,开展了5类水平位移与沉降调节工况的传感光纤室内二维变形试验与2组堆石坝工程内部变形实测数据的模拟验证。研究结果表明5类试验工况下40组试验测得其水平位移和沉降绝对误差均小于1 mm,该二维变形监测方法的变形监测性能优越。基于200 m级坝高堆石坝实测水平位移、沉降数据开展的室内模拟试验,试验结果在曲线形式及量值上均与实测结果吻合度均较高,406 m长的测量断面以测点间距为3.3 m的准分布式监测,测点沉降测量误差为cm级,水平位移测量误差mm级;说明基于分布式传感光纤技术的二维变形监测方法,可满足岩土体变形监测需要,具备良好的应用前景。Abstract: The scientific and reasonable deformation monitoring of rock and soil masses is an important index for the evaluation of stability and safety of geotechnical engineering. Given full play to the characteristics of distributed optical fiber sensing measurement technology, based on the specially designed optical fiber deformation test devices, a two-dimensional deformation monitoring method based on the distributed optical fiber sensing technology is proposed. The indoor two-dimensional deformation tests of sensing optical fiber under five kinds of horizontal displacement and settlement adjustment conditions and two sets of simulation and verification of the measured internal deformation of rockfill dam project are carried out. The research results show that the absolute errors of horizontal displacement and settlement measured by 40 groups of tests are less than 1 mm under the five kinds of test conditions. The two-dimensional deformation monitoring method has excellent performance. Based on the measured horizontal displacement and settlement data of a 200 m-high rockfill dam, the indoor simulation tests are carried out. The test results are in good agreement with the measured ones in terms of the curve form and measuring value. The 406 m-long measuring section is subjected to quasi-distributed monitoring with the spacing of measuring points of 3.3 m. The settlement measurement error of the measuring points is cm-level, and the horizontal displacement measurement error is mm-level. It is shown that the two-dimensional deformation monitoring method based on the distributed optical fiber sensing technology can meet the needs of deformation monitoring of rock and soil and has good application prospects.
-
0. 引言
沿海地区的水下地下工程建设不可避免地会受到的地下水渗流影响[1],将导致施工区域软土地基沉降,造成周围建筑物和地面的不均匀沉降。为保持原有地层稳定,人工冻结技术在岩土工程中广泛应用[2],包括海底隧道和城市地铁建设[3]。流速较大条件下易出现冻结壁不闭合的现象[4],不能满足施工设计的要求。
在人工冻结过程中,确定地层的冻结范围是非常重要的。基于热势叠加理论,Hu等[5]和Pimentel等[6]推导了静水和渗流条件下不同冻结形式下的稳态温度场的理论公式,用来预测圆形冻结壁的厚度和平均温度[7]。地下水渗流的存在使等温线向下游移动,下游冻结壁厚度大于上游[8]。但现有的解析解不能揭示多孔介质冻结过程中渗流与各物理场的耦合机制。
当存在地下水渗流时,水流携带的热量导致冻结区的解冻[9],研究渗流条件下冻结过程中的多场耦合机制是必要的。考虑冻结过程中多场耦合变化,建立了渗流条件下人工冻结过程多场耦合数值模型[10]。饱和土的冻结过程涉及多场、多相,针对沿海地区地下水含盐量高的问题[11],在多孔介质理论框架下建立多场宏观模型,模拟地下水渗流条件下的冻结过程。
本文建立了渗流条件下砂地层在人工冻结时的水-盐-热-力耦合模型。充分考虑非对流通量对传热传质的影响,固体颗粒对盐的解吸和吸附作用,以准确模拟人工冻结过程。采用Navier-Stokes方程来考虑渗流过程中流体的动量守恒,研究了单管冻结条件下,不同渗流速度下滨海砂地层中各组分的分布规律。
1. 控制方程
1.1 固体基质质量守恒方程
多孔介质中固体基质的质量守恒方程为[12]:
1(1−n)∂n∂t+1(1−wsp)∂wsp∂t+βsT∂T∂t=βsP∂Pl∂t+∂εv∂t。 (1) 式中:wsp为固体颗粒吸附盐的质量分数;T为温度;Pl为孔隙水力压力。
1.2 水分守恒方程
多孔介质中水分质量守恒方程的展开式为
nSl(1−wlp)βlpρl∂Pl∂t+div(ρlwql)−div(jlp)=−∂mi∂t−∂mlp∂t+nρlw∂Si∂t+nρlwSp∂t−Slρlw∂n∂t+nSlρl[(1−wlp)βlw+1]∂wlp∂t−nSlρlw∂εv∂t+(1−wlp)nSlβlTρl∂T∂t。 (2) 式中:βlp为液相压缩率;βlT为液体热膨胀系数;βlw为浓度依赖系数;∂mi/∂t为冰的结晶速率;∂mlp/∂t为结晶盐水合物的形成速率;jlp为盐在液相中的非对流通量;ρlw为液态的水密度;ρl为液相的密度;wlp溶解盐的质量分数。
冰的质量守恒方程为[13]
1n∂n∂t+1Si∂Si∂t+∂εv∂t=1nSiρi∂mi∂t, (3) 式中,ρi为冰的密度。
1.3 盐分守恒方程
考虑冻结多孔介质液相中盐溶液的非对流通量,溶液的质量守恒为
∂(nSlρlp)∂t+div(nSlρlpvl)+div(jlp)=−∂mp∂t−∂mlp∂t。 (4) 式中:jlp为冻土中盐的非对流通量;∂mp/∂t为结晶盐的相变速率。
可得到展开的溶液质量守恒方程:
1n(1−ρswspρlwlp)∂n∂t−1Sl∂Si∂t−1SlSp∂t+∂εv∂t+[βlp+(1−n)wspρsnSlρlwlpβsP]∂Pl∂t+(1−wlpβlw)wlp∂wlp∂t+1wlp(1−n)ρsnSlρl∂wsp∂t−[(1−n)wspρsnSlρlwlpβsT+βlT]∂T∂t=div(ρlwlpql)+div(jlp)−∂mp∂t−υlMlMp∂mp∂tnSlρlwlp。 (5) 式中:wlp为液相中盐的质量分数;jlp冻为土中盐的非对流通量;ql为液相相对流动体积;Ml为液体的摩尔质量;Mp为结晶盐的摩尔质量。
考虑多孔介质中盐的吸附-解吸效应,冻土中盐分的沉积动力学公式为
(1−n)ρs∂wsp∂t + div[(1−n)ρsvs]=kadnSlρlwlp−kde(1−n)ρswsp, (6) 式中,kad和kde分别为吸附系数和解吸系数。
结晶盐的质量守恒方程为[13]
1n∂n∂t+1Sp∂Sp∂t+∂εv∂t=1nρpSp∂mp∂t, (7) 式中:ρp为结晶盐的密度。
1.4 能量守恒方程
多孔介质冻结过程中的能量守恒与热容和热传导度有关,能量守恒方程表示为
[(1−n)ρscs+nSlρlcl+nSiρicii+nSpρpcpp]∂T∂t+div[(clpjlp−ρlclql)(T−T0)−λeff∇T]=Lwi∂mi∂t+Lsc∂mp∂t+LlpυlMlMp∂mp∂t。 (8) 式中:g为重力加速度矢量;λeff为冻土有效导热系数;cs,cl,cii和cpp分别代表固体颗粒、液相、冰和结晶盐的热容;Lwi,Llp,Lsc分别为水、冰的相变潜热、自由水、结合水相变潜热和溶液-结晶盐的相变潜热。
1.5 动量守恒方程
人工冻结过程中的各向异性和渗流状态影响着砂土地层的冻结状态,在动量守恒中引入Navier-Stokes方程来描述渗流的动量守恒。土体冻结过程中π相的动量守恒方程为
ρπnπdvπdt−div(nπσπ)−ρπnπgπ=˙mπ。 (9) 式中:σπ为π相的应力张量;˙mπ为π相与其他相的动量交换,gπ为π相的体积密度。
可得到土体的动量守恒方程:
nρl(Fg−∇Plρl+μl∇2vl)−div(σ′+SlPl+SiPi+SpPp)−[(1−n)ρs+nSlρl+nSiρi+nSpρp]g=˙mπ。 (10) 式中:Fg为单位质量力;μl为液相的动力黏度;Pi为冰压力;Pp为孔隙中盐结晶压力;σ′为有效应力。
1.6 边界条件
将耦合方程(1)~(3),(5)~(8),(10)代入COMSOL Multiphysics进行求解。边界与外部存在热对流和热交换和水、盐供应。要解耦合方程,必须满足下列边界条件:
(ρlwql−jlp)⋅n=¯Pl , (ρlwlpql+jlp)⋅n=¯wlp , [(ρlwclwql+clpjlp)⋅(T−T0)−λeff∇T]⋅n=¯T , σ⋅n=¯εv 。} (11) 2. 理论验证
结合Wang等[14]的渗流条件下人工冻结过程温度场验证本文理论模型。模型试验如图 1所示,箱体中间设置一根外径为42 mm的冷冻管。整个模型的初始温度为10℃,冻结管的初始温度为-30℃。在箱体0.4 m处设置D轴。表 1给出了本研究使用的物理参数,模型试验所用砂土的干密度为1612 kg/m3,孔隙率为0.33,渗透系数为2.28×10−4 m/s。理论模型中D轴的温度分布结果与试验结果对比如图 2所示。可以看出理论分析结果与模型试验结果基本一致。
名称 符号 值 单位 名称 符号 值 单位 吸附系数 kad 2.5×10⁻⁴ s-1 水冰相变潜热 Lwi 6.01 kJ·mol-1 解吸系数 kde 1.5×10⁻⁴ s-1 液相压缩率 βlp 1×10⁻⁷ kPa-1 固相热膨胀系数 βsT 7.8×10⁻⁶ K-1 液体热膨胀系数 βlT 2.1×10⁻⁴ K-1 浓度依赖系数 βlw 0.6923 — 液态水密度 ρlw 1000 kg·m-3 冰的密度 ρl 917 kg·m-3 摩尔气体常数 R 8.2 J·mol-1·K-1 结晶盐密度 ρp 1460 kg·m-3 结晶盐的物质的量 Mp 0.142 kg·mol-1 盐的动力学参数 Kp 1.8×10⁻³ s-1 液相的物质的量 Ml 0.018 kg·mol-1 吸湿膨胀系数 βs 1.5×10⁻⁴ — 固体热容 cs 850 J·kg-1·K-1 冰的动力学参数 Ki 5.82×10⁻³ s-1 冰的热容 cii 2090 J·kg-1·K-1 自由水结合水相变潜热 Llp 73.04 kJ·mol-1 结晶盐的热容 cpp 1743 J·kg-1·K-1 盐、结晶盐相变潜热 Lsc 2.34 kJ·mol-1 固相压缩率 βsp 2×10⁻⁴ kPa-1 ![]()
3. 参数研究
通过参数化研究,分析了不同渗流速度和温度梯度下各组分在砂层中的空间分布。砂土层模型试验渗流如图 3所示。模型边界目标参数如表 2所示,砂层中wlp0和T0的初始值分别为0.005和10℃。冻结管壁温度设为-27℃,渗流只存在于砂层底部。冰饱和度Si、结晶盐饱和度Sp、吸收盐含量wsp0的初始条件和边界条件均为0。选取图 2中位于砂层中4条轴线Dc,Ds,Ic,Is,绘制温度、冰、盐、位移分布图。
表 2 参数分析中使用的目标参数Table 2. Target parameters used in parametric studies项目 Pl0/kPa Tp/℃ T0/℃ wlp0 wlp 渗流/(m·d-1) 试验 γwΔH -30 10 — — 0, 3 渗流 γwΔH -27 13 0.005 0.005 0, 5, 10 不同渗流速度的下部砂层中温度沿D轴和I轴分布情况如图 4所示。随着渗流速度从0 m/d增加到10 m/d,在人工冻结70 h后,在沿着D轴方向上的砂层上游的温度增加8.8℃,下游最高降低了13.2℃,如图 4(a)所示。当渗流速度从0 m/d增加到10 m/d,人工冻结70 h后,冻结管左右两侧的沿着I轴的温度升高了6.2℃,如图 4(b)所示。
![]() 图 4 在不同渗流速度下,冻结10,75 h后,砂层中温度分布Figure 4. Distribution of temperature along (a) D axis and (b) I axis in sand stratum after 10 and 75 hours of freezing under different seepage velocities
图 4 在不同渗流速度下,冻结10,75 h后,砂层中温度分布Figure 4. Distribution of temperature along (a) D axis and (b) I axis in sand stratum after 10 and 75 hours of freezing under different seepage velocities不同渗流速度对下部砂层中含冰量沿D轴和I轴分布情况如图 5所示。渗流导致水分开始冻结的位置沿着D轴向下游移动。随着渗流速度从0 m/d增加到10 m/d,在人工冻结70 h后,在沿着D轴方向上的砂层上游水分冻结的位置向下游移动了63.5%,下游中水分冻结的位置向下游移动了173.2%,如图 5(a)所示。当渗流速度从0 m/d增加到10 m/d,即人工冻结70 h后,冻结管左右两侧的沿着I轴的水分冻结范围缩减了37.8%,如图 5(b)所示。
![]() 图 5 在不同渗流速度下,冻结10,75 h后,砂层中冰含量分布Figure 5. Distribution of ice content along (a) D axis and (b) I axis in sand stratum after 10 and 75 hours of freezing under different seepage velocities
图 5 在不同渗流速度下,冻结10,75 h后,砂层中冰含量分布Figure 5. Distribution of ice content along (a) D axis and (b) I axis in sand stratum after 10 and 75 hours of freezing under different seepage velocities不同渗流速度对下部砂层中结晶盐量沿D轴和I轴分布情况如图 6所示。图 6(a)给出了沿着渗流方向上结晶盐含量随着渗流和冻结时间变化的分布情况,盐分析出的位置沿着D轴向下游移动。随着渗流速度从0 m/d增加到10 m/d,在人工冻结70 h后,在沿着D轴方向上的砂层上游盐分开始析出的位置向下游移动了65.1%,下游中盐分开始析出的位置向下游移动了182.7%。当渗流速度从0 m/d增加到10 m/d,即人工冻结70 h后,冻结管左右两侧的沿着Ⅰ轴的盐分的析出范围缩减了42.7%,如图 6(b)所示。
![]() 图 6 在不同渗流速度下,冻结10,75 h后,砂层中结晶盐含量分布Figure 6. Distribution of crystalline salt content along (a) D axis and (b) I axis in sand stratum after 10 and 75 hours of freezing under different seepage velocities
图 6 在不同渗流速度下,冻结10,75 h后,砂层中结晶盐含量分布Figure 6. Distribution of crystalline salt content along (a) D axis and (b) I axis in sand stratum after 10 and 75 hours of freezing under different seepage velocities不同渗流速度对下部砂层吸附盐含量沿D轴和I轴分布的影响如图 7所示。渗流削弱了下游的盐分吸附能力。随着渗流速度从0 m/d增加到10 m/d,在人工冻结70 h后,在沿着渗流的D轴方向上,砂层上游的吸附盐突变位置向下游移动了52%,下游的吸附盐突变位置向下游移动了32%,如图 7(a)所示。当渗流速度从0 m/d增加到10 m/d,即人工冻结70 h后,冻结管左右两侧的沿着I轴的吸附盐突变范围向冻结管方向缩小了16.2%,如图 7(b)所示。
![]() 图 7 在不同渗流速度下,冻结10,75 h后,砂层中吸附盐含量分布Figure 7. Distribution of adsorbed salt content along (a) D axis and (b) Ⅰ axis in sand stratum after 10 and 75 hours of freezing under different seepage velocities
图 7 在不同渗流速度下,冻结10,75 h后,砂层中吸附盐含量分布Figure 7. Distribution of adsorbed salt content along (a) D axis and (b) Ⅰ axis in sand stratum after 10 and 75 hours of freezing under different seepage velocities不同渗流速度对下部砂层中土体位移沿D轴和I轴分布情况如图 8所示。随着冻结时间的增加,砂地层在冻胀和盐胀的作用下土体位移逐渐增加。随着渗流速度从0 m/d增加到10 m/d,在人工冻结70 h后,在沿着D轴方向上的砂层上游的土体位移降低了33.4%,下游的土体位移降低了14.3%,如图 8(a)所示。当渗流速度从0 m/d增加到10 m/d,即人工冻结70 h后,冻结管左右两侧的沿着I轴的土体位移降低了23.1%,如图 8(b)所示。
![]() 图 8 在不同渗流速度下,冻结10,75 h后,砂层中位移分布Figure 8. Distribution of soil displacement along (a) D axis and (b) I axis in sand stratum after 10 and 75 hours of freezing under different seepage velocities
图 8 在不同渗流速度下,冻结10,75 h后,砂层中位移分布Figure 8. Distribution of soil displacement along (a) D axis and (b) I axis in sand stratum after 10 and 75 hours of freezing under different seepage velocities4. 结论
本文推导了渗流条件滨海砂土层人工冻结的水-盐-热-力学耦合模型。利用COMSOL Multiphysics软件对导出的微分方程进行求解。理论计算结果与文献中实验室模型试验结果吻合较好,验证了模型的准确性。通过参数分析,研究了不同渗流速度下的砂地层中各组分的空间分布情况。得出以下3点结论。
(1)在砂层冻结后,地层中的孔隙被堵塞,砂层底部上游的高温流体穿过地层的左右两侧下游流动。随着渗流速度从0 m/d增加到10 m/d,在人工冻结70 h后,砂层上游的最高温度增加8.8℃。冻结管左右两侧的土体位移降低了23.1%,渗流削弱了冻结效果,减小了冻结导致的土体位移。
(2)在垂直于渗流方向上,冻结管左右两侧的冰、结晶盐对称分布。在人工冻结70 h后,随着渗流速度从0 m/d增加到10 m/d,砂层上游水分冻结位置向下游移动63.5%,下游中水分冻结位置向下游移动173.2%,冻结管左右两侧的水分冻结范围缩减37.8%。
(3)冻结区域中盐分的吸附能力是被抑制的。随着渗流速度从0 m/d增加到10 m/d,在人工冻结70h后,砂层上游的吸附盐突变位置向下游移动52%,下游的吸附盐突变位置向下游移动32%,冻结管左右两侧的吸附盐突变范围向冻结管方向缩小16.2%。
-
![]()
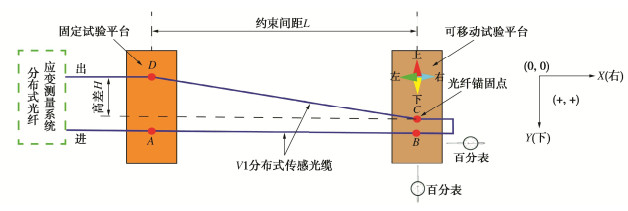
图 1 基于分布式光纤传感的二维变形监测试验装置示意图
Figure 1. Schematic diagram of two-dimensional deformation monitoring test devices based on distributed optical fiber sensoring technology
![]()
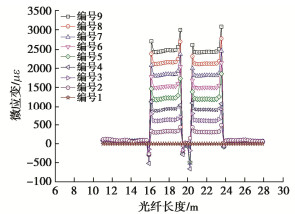
图 2 典型试验阶段BOTDA测量光纤应变曲线
Figure 2. Curves of optical fiber strain measured by BOTDA at typical test stage
![]()
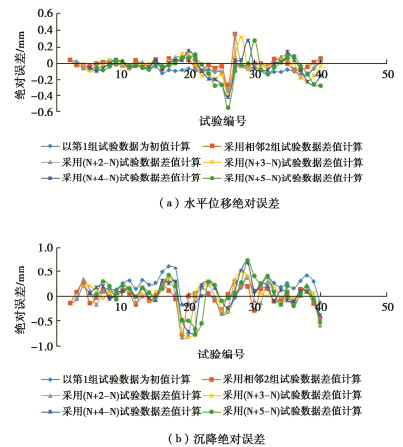
图 3 40组试验数据不同差值计算方法绝对误差统计分析结果
Figure 3. Statistical results of absolute error by using different difference methods for 40 groups of test data
![]()
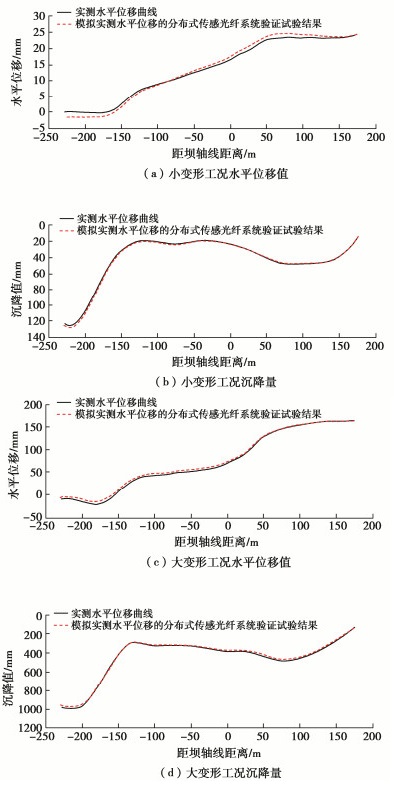
图 4 实测水平位移、沉降与室内二维变形试验模拟结果对比分析曲线
Figure 4. Comparative curves of measured horizontal displacement and settlement with simulated results of indoor two- dimensional deformation tests
表 1 试验操作调节距离与测试位置统计表
Table 1 Statistical table of test operation distances and test positions
(单位: mm) 编号 调节距离 测试点位 编号 调节距离 测试点位 1 — (0, 0) 21 — (8, 30) 2 右1 (1, 0) 22 左-2上-5 (6, 25) 3 右1 (2, 0) 23 左-1.2上-5 (4.8, 20) 4 右1 (3, 0) 24 左-1.2上-5 (3.6, 15) 5 右1 (4, 0) 25 左-1.2上-5 (2.4, 10) 6 右1 (5, 0) 26 左-1.2上-5 (1.2, 5) 7 右1 (6, 0) 27 左-1.2上-5 (0, 0) 8 右1 (7, 0) 27 — (0, 0) 9 右1 (8, 0) 28 右1上-5 (1, -5) 9 — (8, 0) 29 右1上-5 (2, -10) 10 下2 (8, 2) 30 右1上0 (3, -10) 11 下2 (8, 4) 31 右1上-5 (4, -15) 12 下2 (8, 6) 32 右1上-5 (5, -20) 13 下2 (8, 8) 33 右1上-5 (6, -25) 14 下2 (8, 10) 34 右1上-5 (7, -30) 15 下3 (8, 13) 35 右1上-5 (8, -35) 16 下3 (8, 16) 35 — (8, -35) 17 下4 (8, 20) 36 左-1下5 (7, -30) 18 下5 (8, 25) 37 左-1下5 (6, -25) 19 下5 (8, 30) 38 左-2下5 (4, -20) 20 下10 (8, 40) 39 左-2下10 (2, -10) 21 上-10 (8, 30) 40 左-2下10 (0, 0) 注:本次试验以向下移动为正,向右移动为正;以向下移动为负,向左移动为负。  下载: 导出CSV
-
[1] 莫伟樑, 杨雨冰, 林越翔, 等. 基于OFDR技术的盾构隧道管片错台变形测量与计算方法[J]. 现代隧道技术, 2022, 59(5): 179-187. https://www.cnki.com.cn/Article/CJFDTOTAL-XDSD202205022.htm MO Weiliang, YANG Yubing, LIN Yuexiang, et al. Measurement and calculation method for shield tunnel segment dislocation deformation based on OFDR technology[J]. Modern Tunnelling Technology, 2022, 59(5): 179-187. (in Chinese) https://www.cnki.com.cn/Article/CJFDTOTAL-XDSD202205022.htm
[2] 随意, 程晓辉, 李官勇, 等. 基于分布式光纤监测的盾构隧道管片变形受力反演分析[J]. 工程力学, 2022, 39(增刊1): 158-163. https://www.cnki.com.cn/Article/CJFDTOTAL-GCLX2022S1023.htm SUI Yi, CHENG Xiaohui, LI Guanyong, et al. Inversion analysis of deformation and force of shield tunnel segments based on distributed optical-fibre monitoring[J]. Engineering Mechanics, 2022, 39(S1): 158-163. (in Chinese) https://www.cnki.com.cn/Article/CJFDTOTAL-GCLX2022S1023.htm
[3] 侯公羽, 李子祥, 胡涛, 等. 基于分布式光纤应变传感技术的隧道沉降监测研究[J]. 岩土力学, 2020, 41(9): 3148-3158. https://www.cnki.com.cn/Article/CJFDTOTAL-YTLX202009033.htm HOU Gongyu, LI Zixiang, HU Tao, et al. Study of tunnel settlement monitoring based on distributed optic fiber strain sensing technology[J]. Rock and Soil Mechanics, 2020, 41(9): 3148-3158. (in Chinese) https://www.cnki.com.cn/Article/CJFDTOTAL-YTLX202009033.htm
[4] 何斌, 徐剑飞, 何宁, 等. 分布式光纤传感技术在高面板堆石坝内部变形监测中的应用[J]. 岩土工程学报, 2023, 45(3): 627-633. doi: 10.11779/CJGE20220089 HE Bin, XU Jianfei, HE Ning, et al. Application of inner deformation monitoring of concrete face rockfill dams based on distributed optical fiber technology[J]. Chinese Journal of Geotechnical Engineering, 2023, 45(3): 627-633. (in Chinese) doi: 10.11779/CJGE20220089
[5] 何宁, 何斌, 张宗亮, 等. 蓄水初期红石岩堰塞坝混凝土防渗墙变形与受力分析[J]. 岩土工程学报, 2021, 43(6): 1125-1130. doi: 10.11779/CJGE202106016 HE Ning, HE Bin, ZHANG Zongliang, et al. Deformation and stress of concrete cut-off wall of Hongshiyan dammed body at initial stage of water storage[J]. Chinese Journal of Geotechnical Engineering, 2021, 43(6): 1125-1130. (in Chinese) doi: 10.11779/CJGE202106016
[6] 何斌, 何宁, 许滨华, 等. 混凝土面板堆石坝面板挠度分布式监测试验[J]. 岩土工程学报, 2020, 42(5): 837-844. doi: 10.11779/CJGE202005005 HE Bin, HE Ning, XU Binhua, et al. Tests on distributed monitoring of deflection of concrete faces of CFRDs[J]. Chinese Journal of Geotechnical Engineering, 2020, 42(5): 837-844. (in Chinese) doi: 10.11779/CJGE202005005
[7] 燕东源, 李长作, 郝海龙, 等. 基于分布式光纤传感技术的边坡岩土体变形智能监测[J]. 自动化与仪器仪表, 2022(12): 176-180, 185. https://www.cnki.com.cn/Article/CJFDTOTAL-ZDYY202212036.htm YAN Dongyuan, LI Changzuo, HAO Hailong, et al. Intelligent monitoring of slope rock and soil deformation based on distributed optical fiber sensing technology[J]. Automation & Instrumentation, 2022(12): 176-180, 185. (in Chinese) https://www.cnki.com.cn/Article/CJFDTOTAL-ZDYY202212036.htm
[8] 毛学军, 张鸿, 旷小林, 等. 边坡岩土体变形监测的光纤光栅测斜仪研发与工程应用[J]. 公路工程, 2015, 40(5): 231-235. https://www.cnki.com.cn/Article/CJFDTOTAL-ZNGL201505052.htm MAO Xuejun, ZHANG Hong, KUANG Xiaolin, et al. Development and application of A fibre grating inclinometer for monitoring the rock and soil slope deformation[J]. Highway Engineering, 2015, 40(5): 231-235. (in Chinese) https://www.cnki.com.cn/Article/CJFDTOTAL-ZNGL201505052.htm
[9] 施斌, 顾凯, 魏广庆, 等. 地面沉降钻孔全断面分布式光纤监测技术[J]. 工程地质学报, 2018, 26(2): 356-364. https://www.cnki.com.cn/Article/CJFDTOTAL-GCDZ201802010.htm SHI Bin, GU Kai, WEI Guangqing, et al. Full section monitoring of land subsidence borehole using distributed fiber optic sensing techniques[J]. Journal of Engineering Geology, 2018, 26(2): 356-364. (in Chinese) https://www.cnki.com.cn/Article/CJFDTOTAL-GCDZ201802010.htm
[10] 卢毅, 施斌, 于军, 等. 地面变形分布式光纤监测模型试验研究[J]. 工程地质学报, 2015, 23(5): 896-901. https://www.cnki.com.cn/Article/CJFDTOTAL-GCDZ201505012.htm LU Yi, SHI Bin, YU Jun, et al. Model test on distributed optical fiber monitoring of land subsidence and ground fissures[J]. Journal of Engineering Geology, 2015, 23(5): 896-901. (in Chinese) https://www.cnki.com.cn/Article/CJFDTOTAL-GCDZ201505012.htm
[11] 程刚, 王振雪, 朱鸿鹄, 等. 基于分布式光纤感测的岩土体变形监测研究综述[J]. 激光与光电子学进展, 2022, 59(19): 51-70. https://www.cnki.com.cn/Article/CJFDTOTAL-JGDJ202219003.htm CHENG Gang, WANG Zhenxue, ZHU Honghu, et al. Research review of rock and soil deformation monitoring based on distributed fiber optic sensing[J]. Laser & Optoelectronics Progress, 2022, 59(19): 51-70. (in Chinese) https://www.cnki.com.cn/Article/CJFDTOTAL-JGDJ202219003.htm


计量
- 文章访问数: 184
- HTML全文浏览量: 21
- PDF下载量: 60